Hi there, and welcome. This content is still relevant, but fairly old. If you are interested in keeping up-to-date with similar articles on profiling, performance testing, and writing performant code, consider signing up to the Four Steps to Faster Software newsletter. Thanks!
Update
The utility described in this post has been moved to the grav repository, see "Performance visualisation tools" for more details.
After watching a great talk by Nitsan Wakart at this year's QCon London, I started playing around with flamegraphs a little more.
To get the gist of Nitsan's talk, you can read his blog post Java Flame Graphs Introduction: Fire For Everyone!.
The important thing to take away is that the collapsed stack files that are processed by Brendan Gregg's FlameGraph scripts are just text files, and so can be filtered, hacked, and modified using your favourite methods for such activities (your author is a fan of
grep and awk).The examples in this post are generated using a fork of the excellent perf-map-agent. I've added a couple of scripts to make these examples easier.
To follow the examples, clone this repository.
Aggregate view
One feature that was demonstrated in Nitsan's talk was the ability to collapse the stacks by Java thread. Usually, flamegraphs show all samples aggregated into one view. With thread-level detail though, we can start to see where different threads are spending their time.This can be useful information when exploring the performance of systems that are unfamiliar.
Let's see what difference this can make to an initial analysis. For this example, we're going to look at a very simple microservice built on dropwizard. The service does virtually nothing except echo a response, so we wouldn't expect the business logic to show up in the trace. Here we are primarily interested in looking at what the framework is doing during request processing.
We'll take an initial recording without a thread breakdown:
$ source ./etc/options-without-threads.sh

$ ./bin/perf-java-flames 7731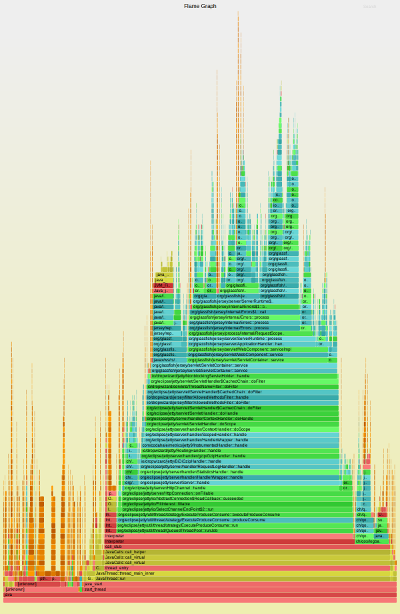
From the aggregated view we can see that most of the time is spent in framework code (jetty, jersey, etc), a smaller proportion is in log-handling (logback), and the rest is spent on garbage collection.
Thread breakdown
Making the same recording, but this time with the stacks assigned to their respective threads, we see much more detail.$ source ./etc/options-with-threads.sh
$ ./bin/perf-java-flames 7602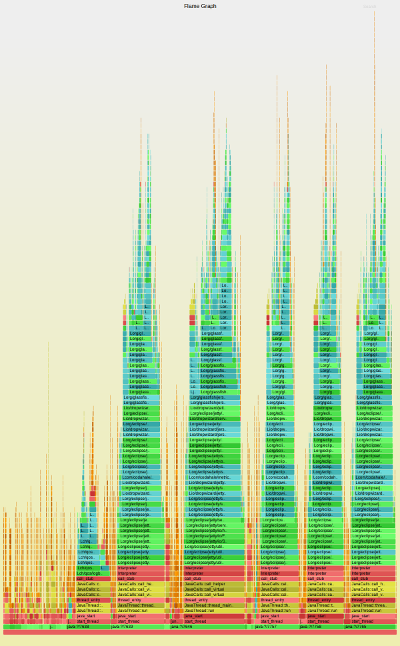
We can also see another thread that spends most of its time writing log messages to disk. From this, we can reason that the logging framework has a single thread for draining log messages from a queue - something that was more difficult to see in the aggregated view.
Now, we have made some assumptions in the statements above, so is there anything we can do to validate them?
Annotating thread names
With the addition of a simple script to replace thread IDs with thread names, we can gain a better understanding of thread responsibilities within the application.Let's capture another trace:
$ source ./etc/options-with-threads.sh

$ ./bin/perf-thread-flames 8513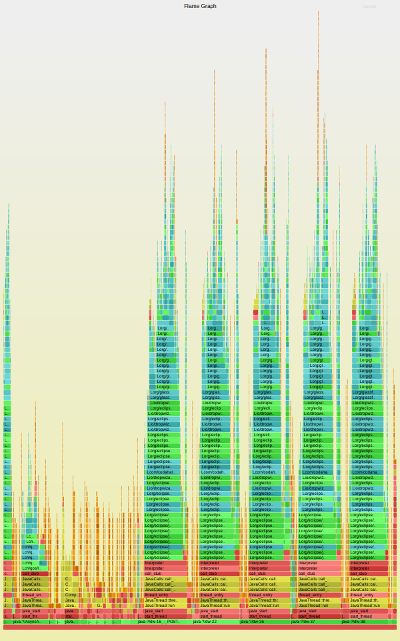
Rolling the mouse over the base of the image shows that the five similar stacks are all from threads named "dw-XX", giving a little more evidence that these are dropwizard handler threads.
There are a couple of narrower stacks named "dw-XX-acceptor"; these are the threads that manage incoming connections before they are handed off to the request processing thread pool.
Further along is a "metrics-csv-reporter" thread, whose responsibility is to write out performance metrics at regular intervals.
The logging framework thread is now more obvious when we can see its name is "AsyncAppender-Worker-async-console-appender".
With nothing more than an external script, we can now infer the following about our application:
- this application has a request-handling thread-pool
- fronted by an acceptor thread
- logging is performed asynchronously
- metrics reporting is enabled
Filtering
Now that we have this extra context in place, it is a simple matter to filter the flamegraphs down to a finer focus.The
perf-thread-grep script operates on the result of a previous call to perf-java-flames (as seen above).Suppose we just wanted to look at what the JIT compiler threads were doing?
$ source ./etc/options-with-threads.sh

$ ./bin/perf-thread-grep 8513 "Compiler"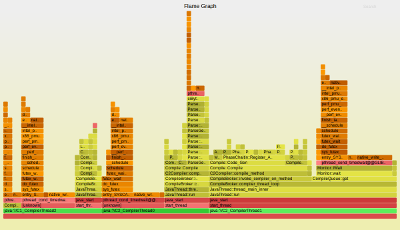
or to focus in on threads that called into any logging functions?
$ source ./etc/options-with-threads.sh

$ ./bin/perf-thread-grep 8513 "logback"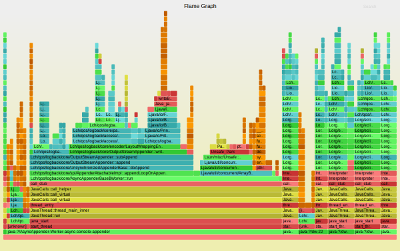
Summary
Annotating flamegraphs with java thread names can offer insight into how an application's processing resources are configured. We can use this extra context to easily zoom in on certain functionality.This technique is particularly powerful when exploring unfamiliar applications with large numbers of threads, whose function may not be immediately obvious.
My learned correspondent Nitsan has suggested that I'm being lazy by using
jstack to generate the thread-name mapping. His main complaint is that it causes a safe-point pause in the running application. To make these scripts a little more lightweight, I will explore retrieving the thread names via JVMTI or another low-level interface. But that's a blog post for another day.Follow @epickrram